
MOUTON interactive is the authorized partner of stat.pl – the platform offering advanced statistics.
Stat.pl are certain, friendly and comparable statistics made for small and medium websites. Stat.pl are the solution for those, who wish to get certain information about searching their sites in an easy and explicit way.
|
|
|
The range of popularity of your website
The stat.pl statistics are a certain solution giving information about using your website. Check the number of the surfers of your website, if they return and how many times they view your website during surfing.
Optimize your website
Make sure that web surfers accept the changes you make and that what you have done is the optimal solution for users. The information about it is to be found in properly used statistics.
Get to know something about your users
Check which sites your users are most interested in, how they surf (paths of their visits). Check where the users come from (a country, region, town / city), what kind of technical specifications they apply (an operational system, a browser), how they have found your site (browsers, key words, catalogues, reference sites).
Strengthen your marketing effectiveness
Make sure that the money you have spent on the advertisement of your site brings calculable effects (the increase of your site visiting, the increase of sale).
The technology of gemiusTraffic research
The unique on the world scale gemiusTraffic research technology, of Gemius SA company, applied in stat.pl statistics allows for monitoring both small and the biggest sites.
Comparable data
Stat.pl are the only statistics that can be compared with the gemiusTraffic research, which is acknowledged in Polish Internet. From now on, you can use the same language while visiting sites and the biggest companies since they also apply the gemiusTraffic technology to check the number of visits on their sites.
Benefits
Friendly, certain, comparable
Stat.pl are friendly, certain and comparable statistics made for small and medium websites. Stat.pl are the chance for those, who wish to easily and explicitly get continuous data about the number of visits on their sites. Stat.pl can be regarded as a tool that allows for optimizing the site according to its users’ preferences. Stat.pl statistics neither require additional endowment nor extra programming. They give the possibility of constantly collecting and presenting data in a friendly interface.
Certainty
 Stat.pl statistics collect and present data about the frequency of viewing sites at a given time and the gemiusTraffic technology assures that the data which are collected relate only to search done by real users.
Easy implementation
 You need only three steps to get knowledge about your site!
After registering and optimizing the contents and search, websites go through three stages:
The explicitness of data
Interface stat.pl is the connection of both explicitness and easiness of use. The interface presents data in such a way that you can find the most important information for yourself and use them best. Our interface was created in Macromedia Flash technology and in order to use it, one needs only the Internet browser with Flash in version 6 plug and a screen with set display resolution of at least 1024x768.
Easy access
 Access to statistics is limited by a login and password. You can add new users, who will have access to your data. Each user, however, has access to only the data that you want to make accessible.
Low costs
Stat.pl statistics do not require either extra investments in programming or in endowment. The installation of stat.pl scripts is so simple that you do not need to take on extra employees.
Accessible data
| Users Visits: The browsing of sites References | Geographical localization Technical Quickstats |
The monitoring of sites
The stat.pl statistics arrange for monitoring websites in traditional technologies (HTML, PHP, APS) and those made in FLASH technology. Stat.pl also enables monitoring websites in a safe SSL connection.
The unique geographical localization
The gemiusTraffic technology involves localizing countries from which users visit your website. This localization is much more precise for Poland. It shows regions and places from which surfers connect (we localize about 2 200 places).
The presentation of data
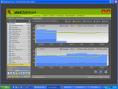
| Column diagrams show quickly the number of visits as well as variable trends on your website | 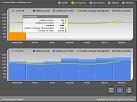 |
| Circular diagrams present proportions of data about characteristics and general profiles of users visiting your website. | 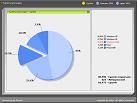 |
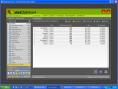
| Tables allow for getting to know about the viewing of your website in detail. They show data in the form of numbers and percentage concerning particular statistics. | 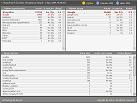 |
| Conclusions present collective data and the average of individual statistics. They also let us find interesting information about the viewing of websites. | 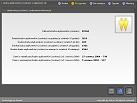 |
| Maps show precisely the places from which users visiting your website get connections. The maps illustrate continents, countries, regions, towns / cities for Poland. | 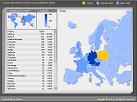 |